Add A Source To gs.log(value, source)
ServiceNow environments can create millions of system logs on a daily basis.
And no one has time to manually sort through them.
So unless your exporting this data to a 3rd party (like Splunk) and analyzing it – you’re probably going to be spending a lot of time combing through logs to find what you’re looking for.
That is – unless you’re familiar with adding a Source to your logs.
A source allows you to filter based on any custom value you provide, so you can more easily sort and access it.
I’m still surprised to see a lot of ServiceNow Admins and Developers throw a gs.log() and then spend 20 minutes looking through every single log in the system. There’s a much faster and more efficient way to be creating your own system logs in ServiceNow.
If you’re kicking off logs and trying to find values in a sea of system logs, consider adding a source value to gs.log().
Adding a source will save you a significant amount of time in your debugging process, as you’re testing different returned values during application development.
Out Of Box Logging For syslog
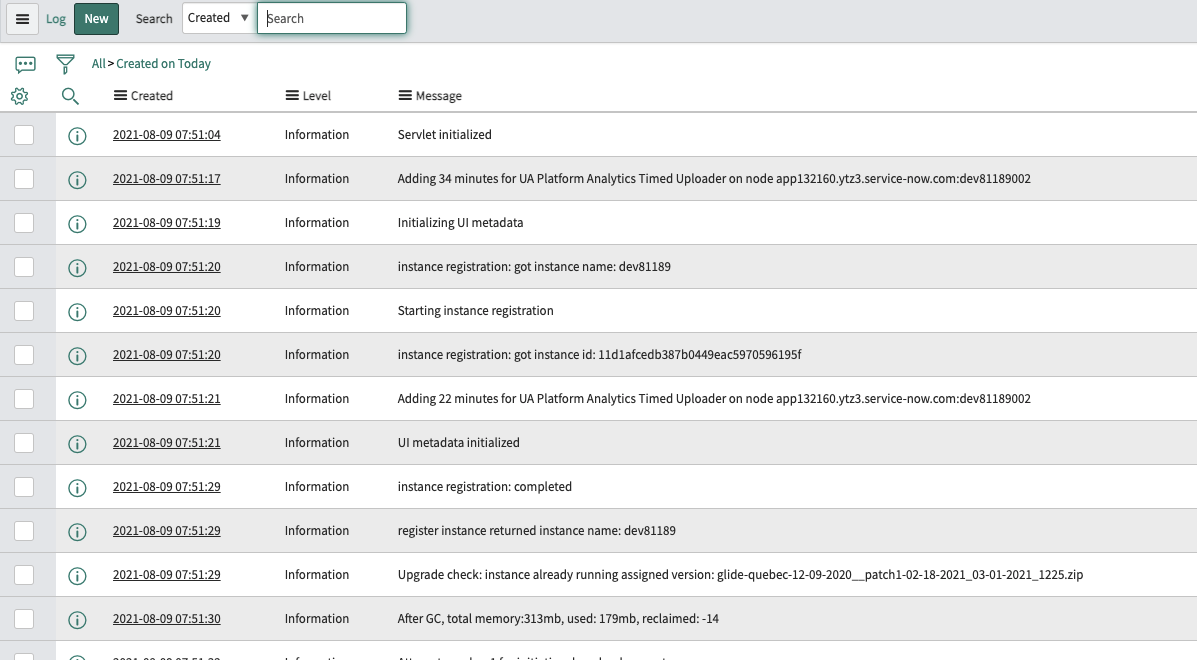
The System Logs [syslog] table in ServiceNow shows all system logs in your environment.
If you want to learn how to quickly sort through large tables like [syslog], check out the .filter notations using the application navigator here.
When logs are generated in ServiceNow whether it’s by the system or an admin, they get pumped to the syslog table which quickly gets disorganized. Out of box, the system has 3 different log levels. Information, Warnings and Errors. All appropriately named. If you are writing a script and are doing it incorrectly, the Warnings and Errors logs will point out what part of the script is breaking the process and throwing an error.
This is what a normal ServiceNow logs table looks like. It’s got a bunch of data from the environment, that is helpful, but tough to make sense of without context, and a lot is auto generated by different areas in the platform.
How To Add A Source To gs.log()
It’s incredibly simple, as you’re just adding another parameter to gs.log().
Most ServiceNow Admins are familiar with gs.log() and will throw logs like this, and never go further in organizing them:
gs.log(“value is logged here”) and then go to the syslogs table to see your log.
So normally, you’d create logs with a script to track certain values that you’re passing around. But this will likely not be a good use of your time, as you then have to navigate to the logs and then find the log you created and the value. Most ServiceNow instances are constantly kicking off different types of logs, so the table gets flooded from all over.
You want to confirm that you have the correct value, before you get to your next step in development.
Say for example, you are performing some development work around priority values and you want to just see when users are changing the priority of incidents.
You can create a simple business rule, and throw a gs.log() with a source.
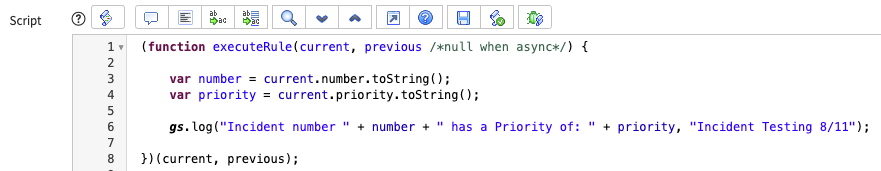
Script:
(function executeRule(current, previous /*null when async*/) {
var number = current.number.toString();
var priority = current.priority.toString();gs.log(“Incident number ” + number + ” has a Priority of: ” + priority, “Incident Testing 8/11”);
})(current, previous);
Now, ServiceNow will start generating a log, every time an incident is inserted/updated.
But the trick here is that each log we create, has a source value of “Incident Testing 8/11”. You can obviously make this value anything that you’d like, as it is a string that is passed. The Source value is where your log came from, and if you’re developing a certain app out – you can put in a value to easily find later on.
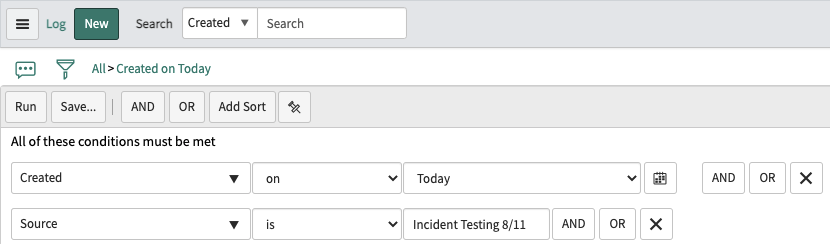
Now go over to the syslog table and view the logs.
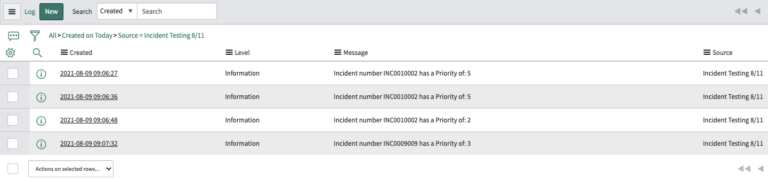
Instead of now looking at every single log, you can just view the logs you want to see.
This search will reveal just a few logs (or as many as the business rule processed) and not every single log in the system.
Which then looks like this:

At this point – you’re done!
This is a much more managable and easily understood view. This can be generated in any server side operation and is guaranteed to save you time in your ServiceNow career.
You are creating a log, passing it values, and then filtering based on your source value.
Try adding a source the next time you create a gs.log() statement and see how easy it is to filter through.
Good luck out there and let us know how you’re using gs.log() in your own environment.
[…] Organize System Logs By Using A Source with gs.log() […]